The case I'm investigating is a little out of the ordinary, in the sense that I assume that I already have the large object in memory. It's not like a more normal case where I send out paged AJAX calls to some REST server.
So, I've created a couple of AngularJS prototypes, which I've analysed with the Chrome Dev tools - the TimeLine tool to be exact. Here are some of my results.
1. Simplest form: load all data into a scope variable
OK, so I started out with the simplest form where I load the 2000 item array into a scope var, and display it using an ng-repeat. Let's see what that does in chrome dev tools:
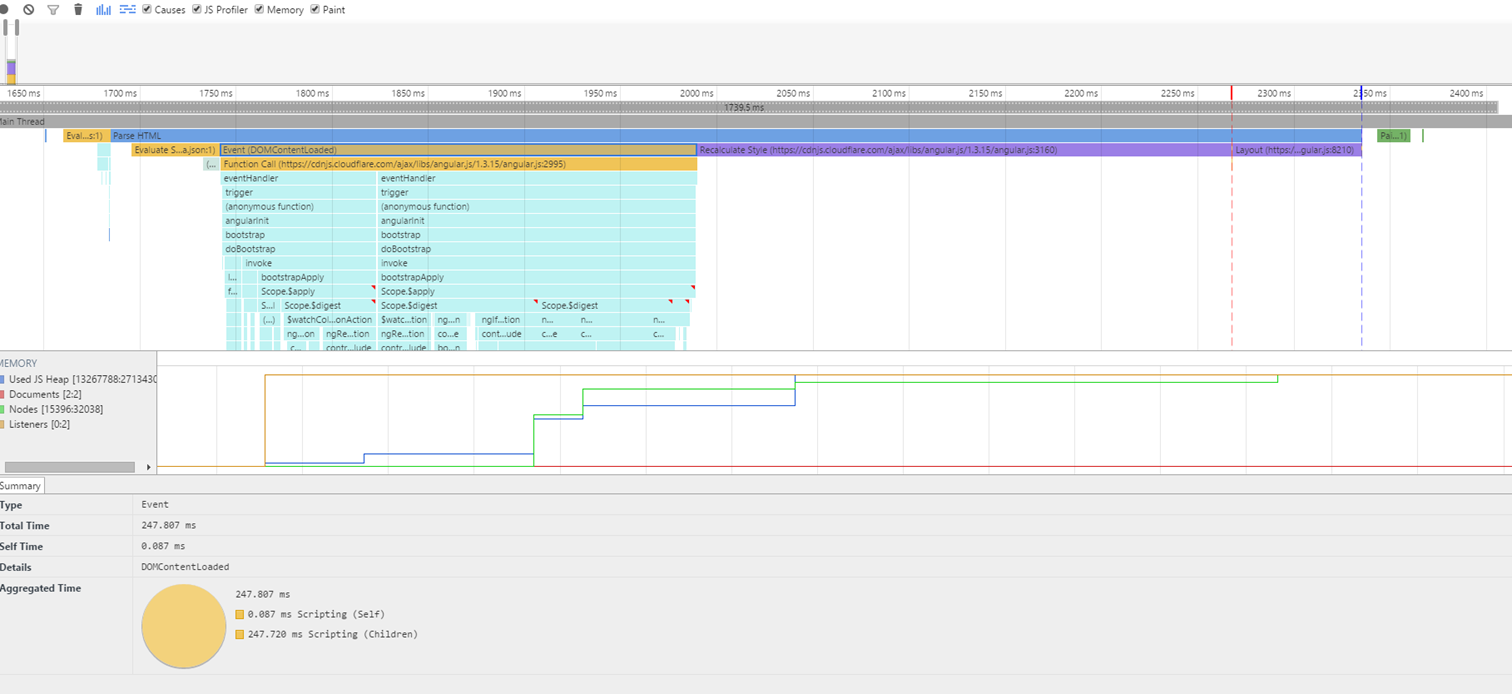
You get this by opening up dev tools, going to TimeLine - hitting record and reloading the page. After clicking stop - you see this awesome graphical representation of the page load events + nested function calls ( flames ).
The DOMContentLoaded event fires and the AngularJS controller needs 200ms to render everything. Note the green line under the flame chart that shows the number of nodes in the DOM.

2. Infinite scroll.
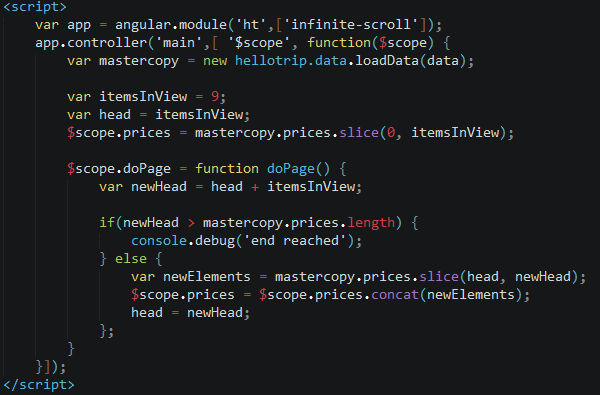
Then I got an infinite scroll module for AngularJS which I applied. OnLoad I load 9 elements into the scope variable and every time the page event fires, I add another 9.

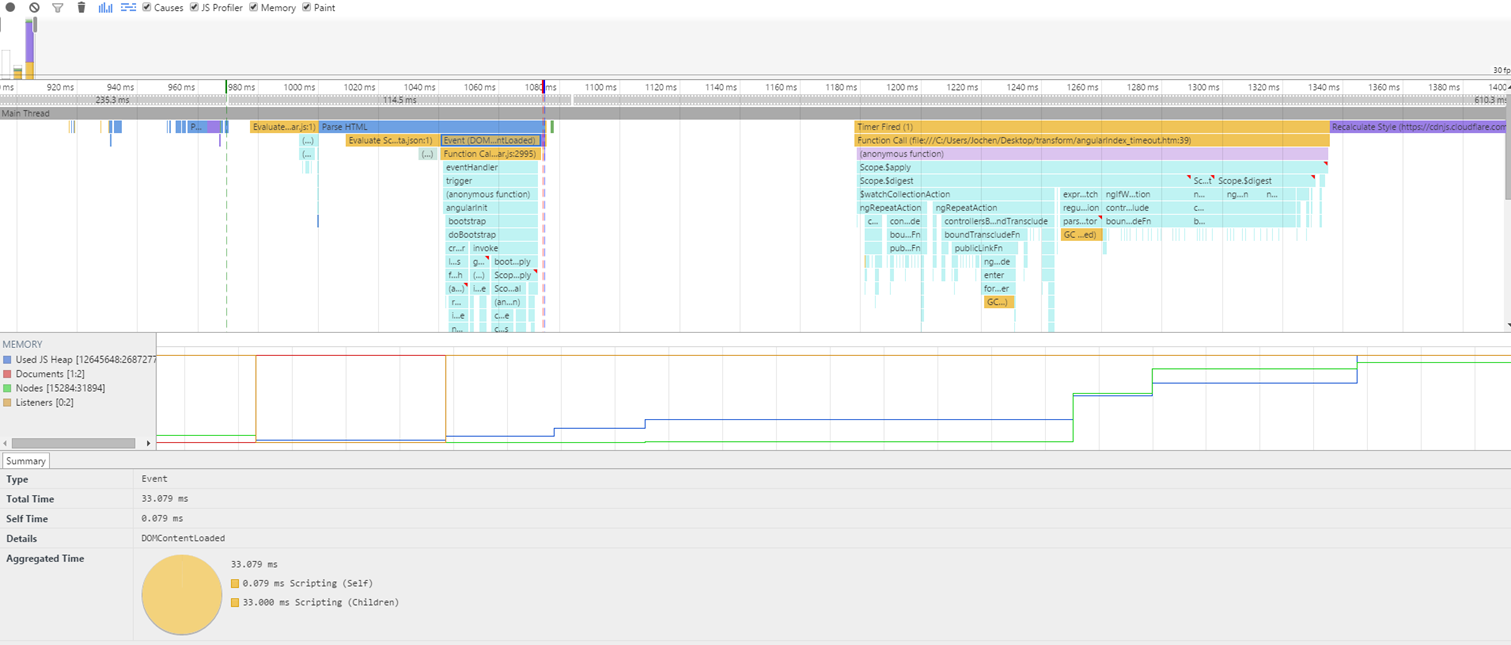
Page load time drops to 30ms (!) that's awesome. The little flames on the right are the scroll events. They take up about 3-5ms. each. This would be a lot more if I was making AJAX calls obviously,
3. Seed loading + background loading of the rest
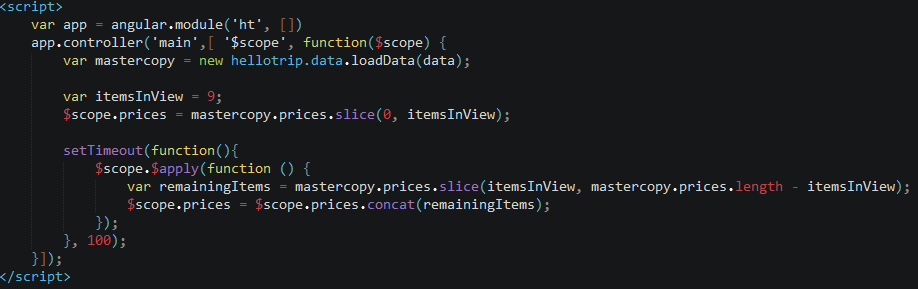
In this prototype, I load enough items to fill up the screen and return from the controller contstructor. Then after a timeout ( 100ms ), I append the rest of the data.
As you can see - a 30ms flame ( so as fast as the infinite scroll solution ) which loads 9 items into the viewmodel and handles the binding. Then after 100ms, I append the rest of the items ( approx 150 ms ). In the browser you see the DOM being built op very quickly and do not notice the rest of the items being loaded. The only thing you can see is the scrollbar jump up after 100ms, when the rest of the items are bound to the viewmodel and generated as HTML.
Right now - the last approach seems the most promising: very quick page load time and 'normal' scroll behavior.
No comments:
Post a Comment